Transcriptional Similarity
Introduction
A core issue in gene expression analysis is determining the similarity between two different gene expression profiles. This is especially true with connectivity mapping, which searches for drugs that cause the opposite changes in gene expression as those caused by a disease. Drugs found in this manner are predicted to reverse the gene expression changes caused by the disease and thereby reverse the disease. As the number of queried drugs is generally large (1000+), drugs are ranked according to their similarity to the disease query signature.
Algorithms used for measuring gene expression similarity include the Kolmogorov-Smirnov (KS) statistic, eXtreme Sum (XSum), and the cosine similarity metric used by the Characteristic Direction Signature Search Engine (L1000 CDS2) and the Combination Connectivity Mapping (ccmap) Bioconductor package.
In order to calculate gene expression similarity, the first step is to determine the extent to which measured transcripts are affected by the disease and queried drugs. As with similarity metrics, methods abound for the determination of differential gene expression. One of the most popular software packages for differential expression analysis is limma. For each gene, limma fits a linear model and estimates variability as a combination of the gene-wise variability and the global variability across all genes.
A more recent approach to differental expression analysis is the characteristic direction (CD) method used by L1000 CDS2. For CD, think of each sample as a point in number-of-gene dimensional space. Now find the plane that best seperates control and treatment points. The vector at right angles to this seperating plane is the characteristic direction. The differential expression of each gene is then determined as the extent to which the CD vector lies along each gene’s axis (analogous to the x and y components of a 2-dimensional vector).
In this post I compare three similarity metrics: KS, XSum, and cosine. I also compare limma and CD differential expression analyses of the l1000 drug expression dataset. These comparisons are accomplished by using query signatures from studies that assayed at least one of 10 drugs also assayed in the l1000 (26,303 perturbagens) and cmap (1,309 drugs) expression datasets. These query signatures should have the greatest similarity with the l1000/cmap drug signature for the same drug.
For the 10 evaluation drugs, crossmeta was used to generate differential expression signatures for 259 individual contrasts from 125 studies which were then used to generate a single meta-analysis signature for each evaluation drug. If effective, meta-analysis through crossmeta should produce signatures with even greater similarity.
Results
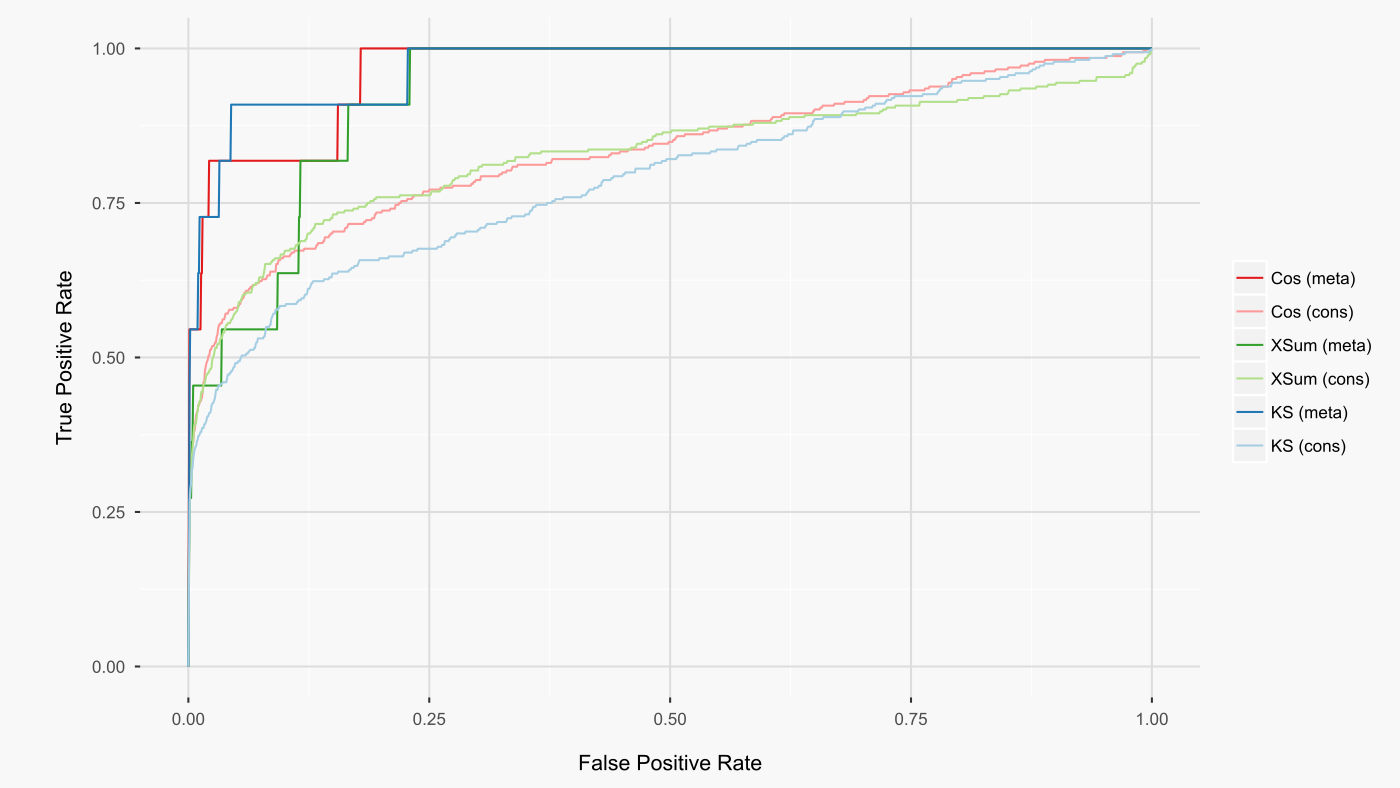
For the limma prepared cmap drug dataset, cosine similarity yielded the highest rankings of the queried drugs amongst all other cmap drugs (figure below). For all metrics, meta-analysis improved these rankings.
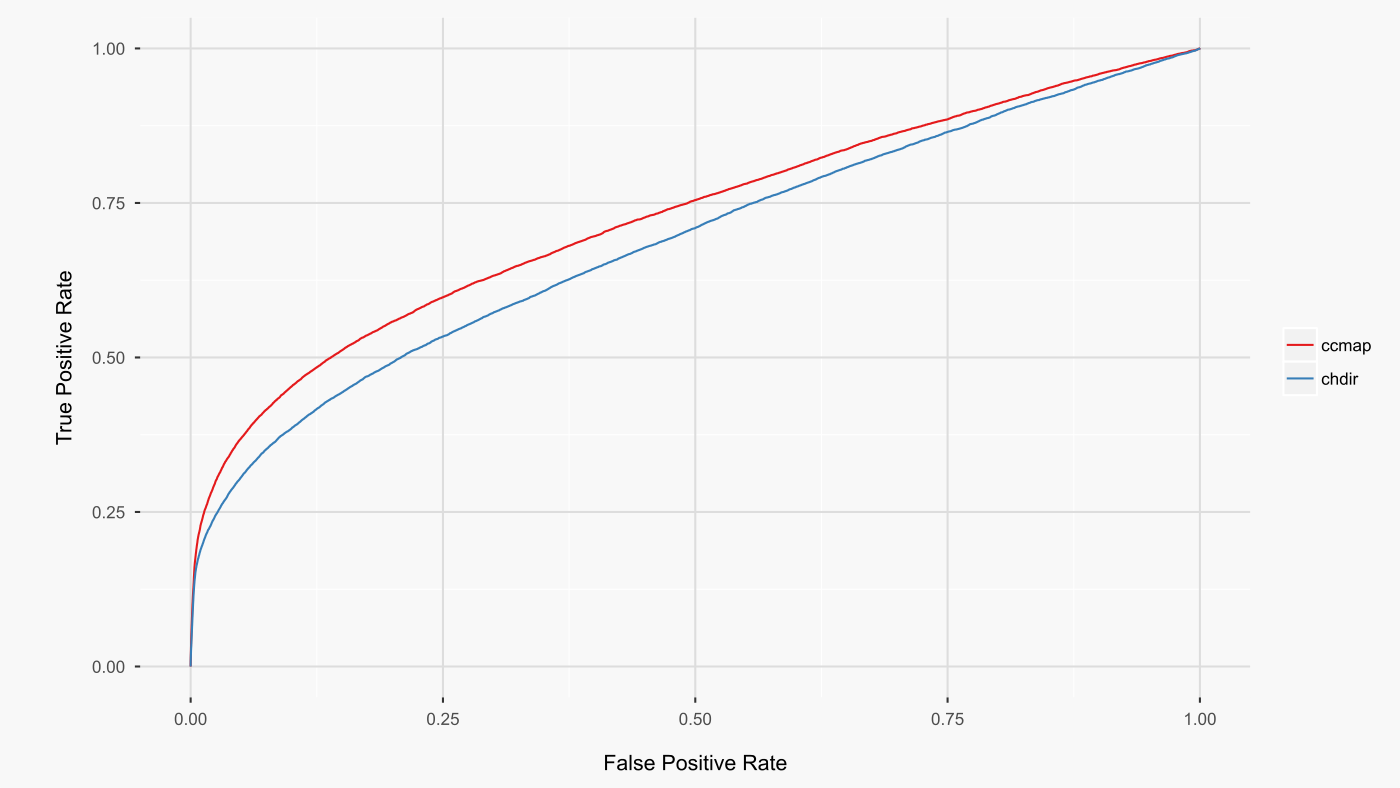
As cosine similarity gave the best results, I implemented this metric for the ccmap R package. This metric is also used by L1000 CDS2, allowing ready comparison between the preparations of the l1000 dataset by L1000 CDS2 (CD method) and ccmap (limma method). When all common signatures are compared between these two preparations of the l1000 dataset, the limma preparation leads to higher rankings of the expected drugs (figure below).
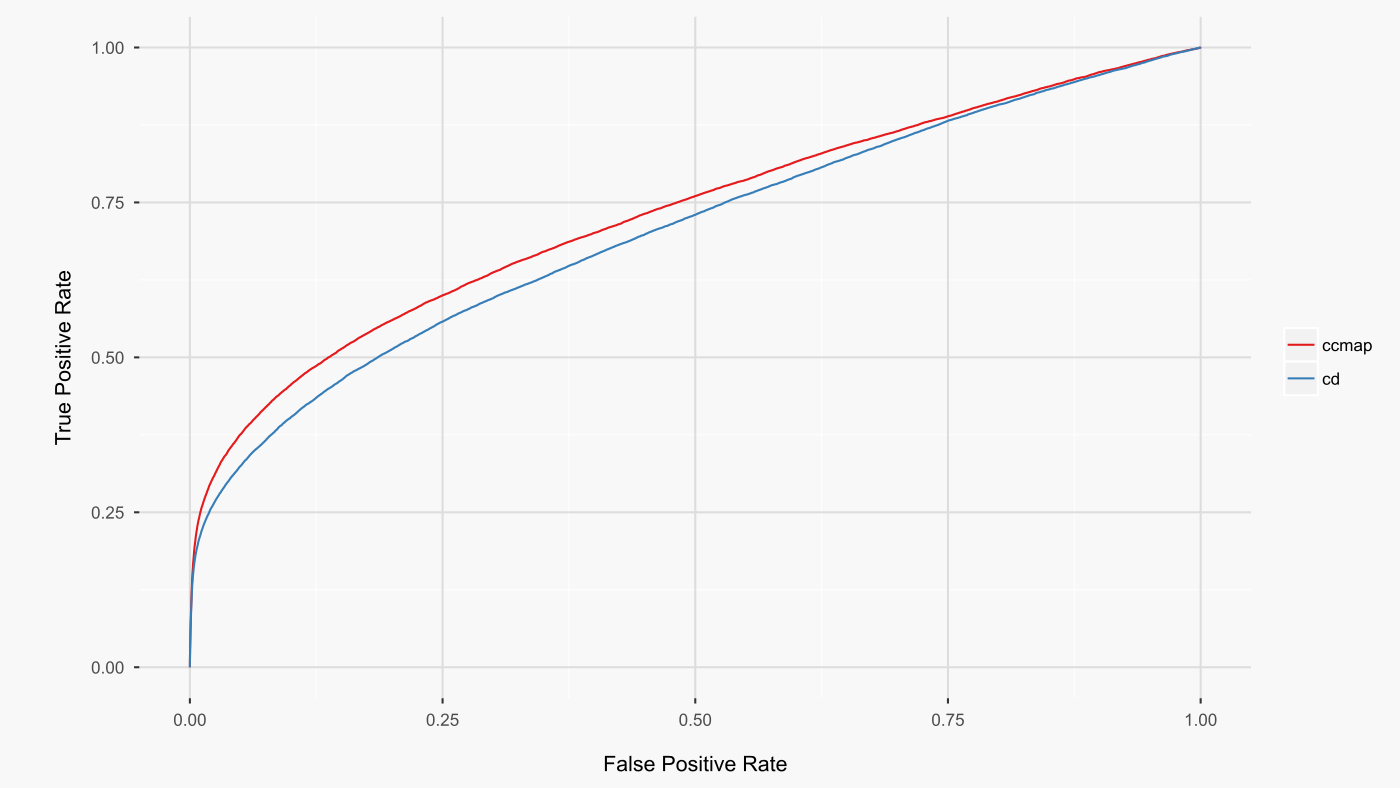
The above analysis directly compared the L1000 CDS2 and ccmap datasets as prepared by their respective authors. A shortcoming of this analysis is that the raw l1000 data deconvolution differed between ccmap and L1000 CDS2. As such, the above results could be attributable to a superior deconvolution by ccmap. To address this possibility, the above analysis was repeated with l1000 CD signatures generated from the same deconvoluted raw data as was used by ccmap. The results (figure below. AUCs: cd 0.703, ccmap 0.731) further strengthen the conclusion that the limma-based analysis of the l1000 dataset is superior to the CD-based differential expression analysis.
A potential objection to the above comparison is that the analysis was done with CD for the l1000 drug signatures but limma for the query signatures. It could be the case that the CD method is superior only if both query and drug signatures are processed using CD differential expression analysis. To address this potential objection, the previous analysis was repeated such that the l1000 CD drug signatures were queried with CD-analysed query signatures. For the query signatures that completed without error using the CD method (254 of 259 contrasts), the results (AUCs: cd 0.704, ccmap 0.732) did not substantially differ. Even when CD is used for both query and l1000 drug signatures, ccmap produces higher rankings of the queried drugs.
The ccmap l1000 dataset includes 19,360 small molecules as well as a total of 6,943 shRNA, overexpression, and protein perturbagens. In contrast, L1000 CDS2 includes only 3,924 small molecules that were determined to have significant signatures (~85% of perturbagens excluded). The utility of this drastic filtering was assesed by comparing queries against l1000 signatures where CD p-values greater than 0.05 were excluded or not.
As this comparison is between l1000 datasets with large differences in the number of signatures, the ROC curve isn’t an appropriate metric for ascertaining if filtering is beneficial. To understand why, note that the x-axis (false positive rate) of an ROC curve is essentially the fraction of queried perturbagens (each query has only a few true positives - the queried drug itself and any similar drugs). When comparing queries with large differences in the number of signatures, a given fraction of queried perturbagens represents a different total number of perturbagens. As such, in order to determine which approach leads to more ‘correct’ results in the top few highest ranking perturbagens, you would have to look at different points along the x-axis for each ROC curve. A more interpretable metric is the number of ‘correct’ signatures within the top few highest ranking signatures. As these top signatures are those most likely to be screened further, it is beneficial if they include more ‘correct’ signatures.
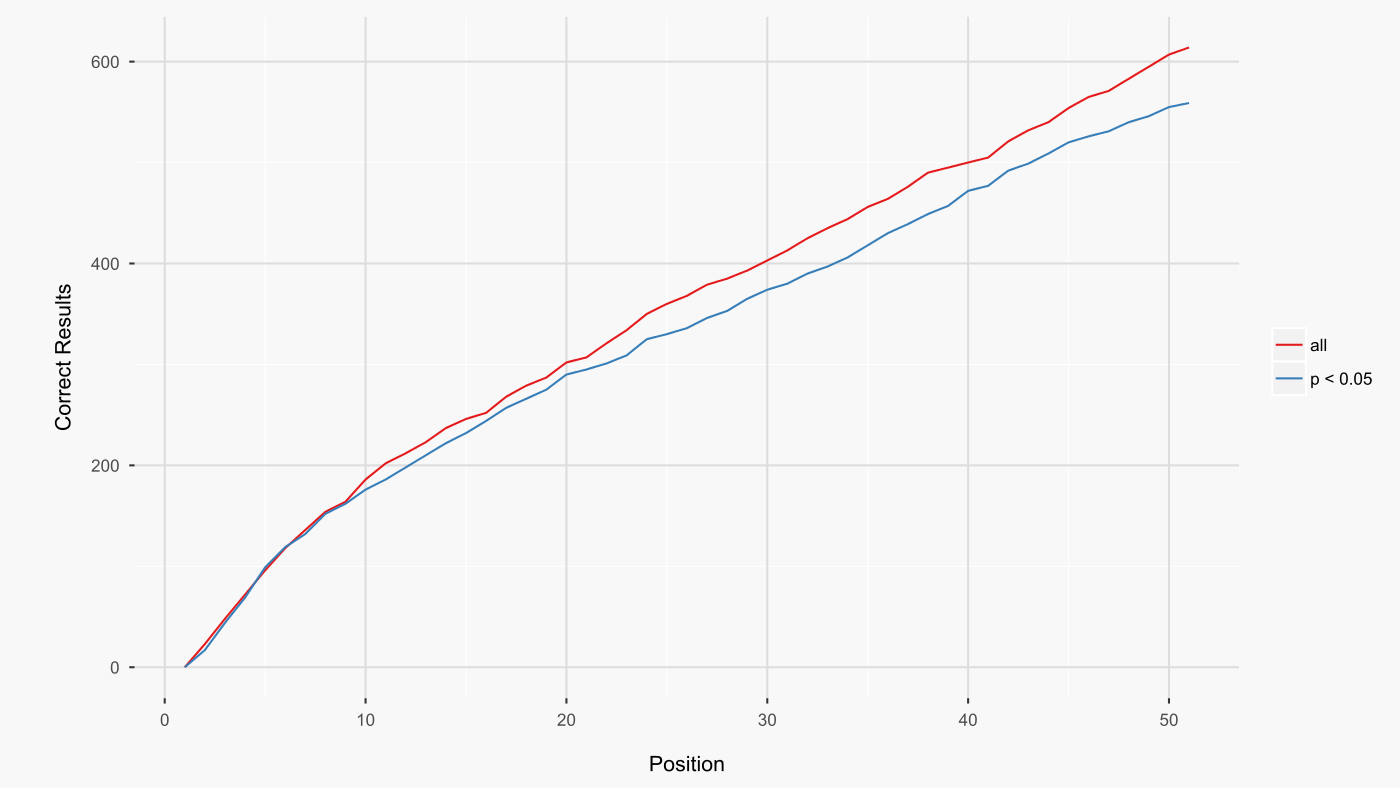
For the 259 contrasts, filtering signatures with CD p-values greater than 0.05 resulted in fewer ‘correct’ signatures among the top 50 (figure below). This finding led me to include all analysed l1000 signatures in ccmap.
Summary
Connectivity mapping is a potentially powerful approach for finding drugs that either treat disease or promote health. Improvements to connectivity mapping will come in the form of improved reliability that the suggested drugs produce the desired changes in gene expression. In this post, I used a collection of 125 public studies that assayed at least one of 10 drugs also assayed in the l1000 drug dataset. This large collection of studies served as a gold-standard for comparing connectivity mapping similarity metrics and data-analysis methods. These comparisons favoured the cosine similarity metric and limma-based differential expression analysis, and form the basis for the current implementation of the Bioconductor package ccmap.