Microarray Meta-Analysis
Why is replication so important to science? Quite simply, replication decreases the chance that you will be wrong. A clear example of why this is true comes from the domain of signal relay. Imagine a binary signal with ten bits that get’s transmitted three times (box below). Faults in any one transmission can be corrected through a simple majority vote. Related principles explain why model ensembling is basically required to win kaggle machine learning competitions.
Original signal:
1010111010
Received signals:
0010111010
1010111110
1010101010
1010111010
A comparable situation arises for microarray data, where the signal is now real numbered gene expression changes for on the order of 20,000 genes. In the following post, I demonstrate that it’s possible to greatly improve the reliability of a gene expression signature by combining data from similar microarray studies with the R package crossmeta. I do this by comparing the overlap between a set of independent gene expression signatures and signatures derived from either individual studies or from the meta-analysis of multiple studies.
The independent microarray signatures were generated by the Broad Institute, which treated human cells with 1309 different drugs as part of their Connectivity Mapping project. These signatures can be accessed from the R package ccmap, which also provides functions for ranking these drug signatures based on their similarity to a query signature.
This ranking functionality of ccmap was exploited to evaluate crossmeta. This was accomplished by using query signatures from studies that assayed at least one of 10 drugs also assayed in the ccmap data. These query signatures should have the greatest similarity with the ccmap drug signature for the same drug. If effective, meta-analysis through crossmeta should produce signatures with even greater similarity.
For the 10 evaluation drugs, crossmeta was used to generate differential expression signatures for 259 individual contrasts from 125 studies which were then used to generate a single meta-analysis signature for each evaluation drug.
The results were very impressive for crossmeta. Meta-analysis improved the rankings of the queried drugs among all other ccmap drugs (figure below - right) and the overlap between the queried drugs and the same ccmap drugs (figure below - left).
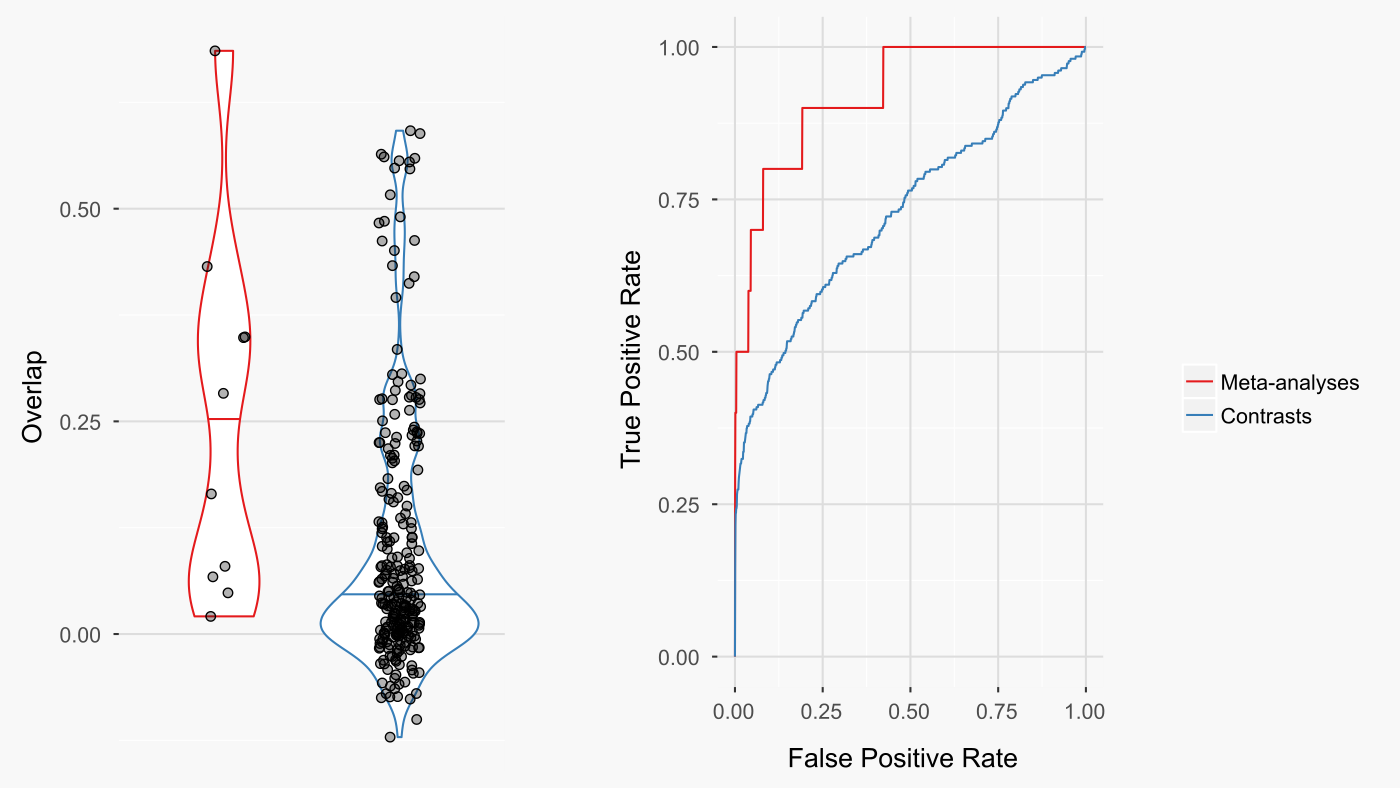
There are cases where the drug meta-analysis signature had poor overlap with the ccmap signature for the same drug (figure below). Despite this, the meta-analysis signature usually overlapped most strongly with ccmap signatures from drugs that either had a similar mechanism of action or a nearly identical chemical structure. This suggests that the fault is with certain ccmap signatures and not with the meta-analysis signature. It also suggests that even when the ideal match has poor overlap, ccmap provides reasonable candidates to mimic the meta-analysis expression signature.
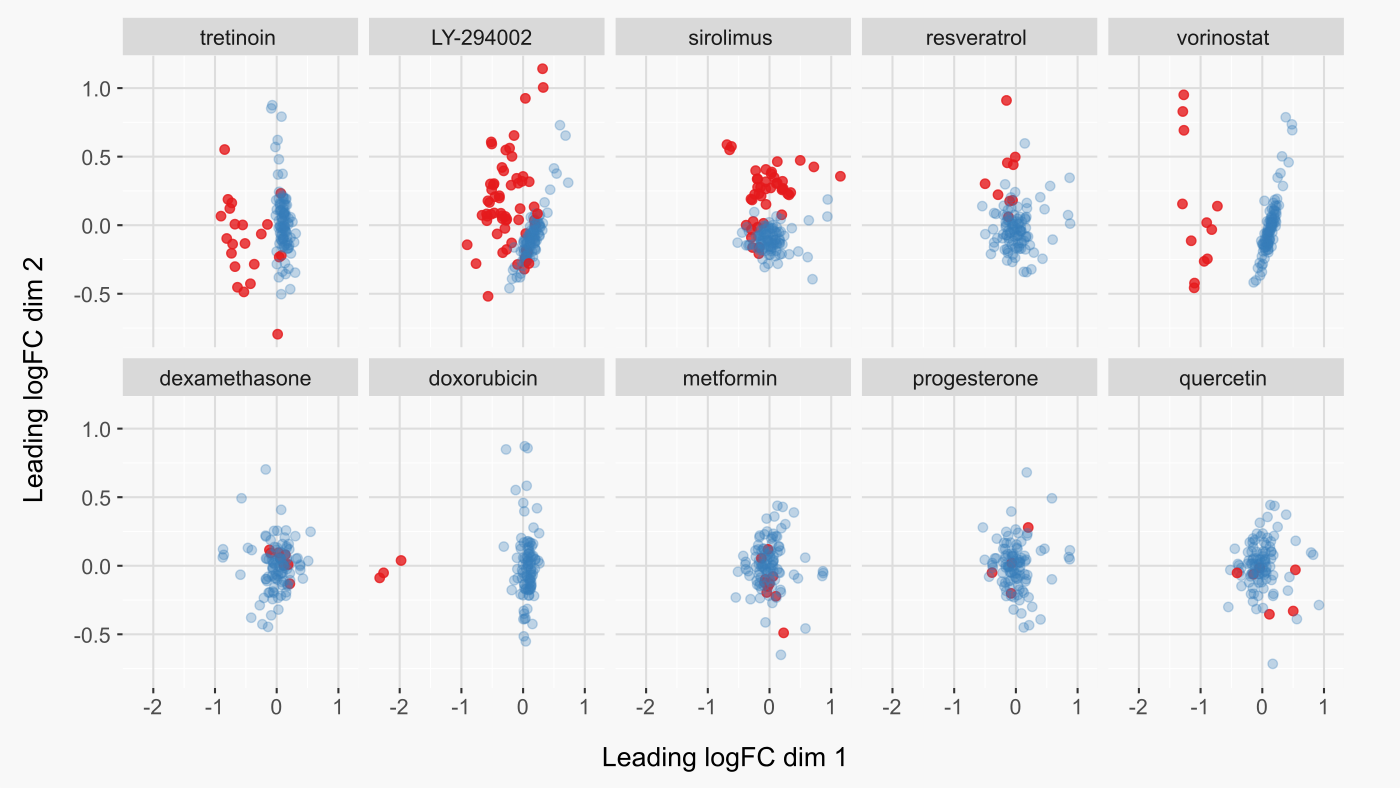
To demonstrate more concretely that cases of poor overlap were due to low quality ccmap signatures, let’s look at the original ccmap data. For cases where the correct ccmap drug was among the top ten best matches for the meta-analysis signature, there is also good separation between control and treatment samples (figure below - top row). In contrast, ccmap drug signatures with poor separation had poor overlap with the meta-analysis signature for the same drug (figure below - bottom row). The one exception is doxorubicin, for which the relatively low rank of 51 appears to have resulted from many similar ccmap expression profiles. Although the ccmap signature for doxorubicin was not among the top ten signatures, its absolute overlap was quite high in comparison to other low-ranking queries (figure above).
Summary
Meta-analysis of microarray expression profiles using crossmeta substantially improves the reliability of gene expression profiles. This was demonstrated using the ccmap Bioconductor package and data from 125 studies that assayed at least one of ten drugs also assayed for the ccmap data. In comparison to drug signatures from individual contrasts, signatures from meta-analysis had much stronger overlap with the ccmap signatures for the same drugs. For cases where the meta-analysis signature had relatively poor overlap with the corresponding ccmap signature, the ccmap signature was likely at fault. This was concluded after observing poor separation between treatment and control samples for these ccmap signatures. Additionally, for these cases, the most strongly overlapping ccmap signatures included drugs with similar mechanisms or structure to the meta-analysed drug. This suggests that even when the ideal match has poor overlap, ccmap provides reasonable candidates to mimic the meta-analysis expression signature.