Surrogate Variable Analysis
In any given experiment there are many variables. There are one or more variables of interest that we would like to understand the consequences of. There are also technical variables that differ between samples because of imperfect instrumentation, experimental practice, etc. Finally, there are biological variables such as genetic, age, and gender differences. Failing to account for these technical and biological sources of variation can lead to faulty conclusions.
In order to reach the correct conclusions, the only option is usually to follow good experimental design. This includes keeping non-desirable variation to a minimum, balancing the remaining sources of variation between experimental groups, and accounting for known sources of variation with statistical models. In general, unknown sources of variation cannot be accounted for. This is not true for microarrays and other high-throughput technologies, where unknown sources of variation can be discovered using the data itself.
This data-driven approach doesn’t necessarily determine the actual unknown variables. Instead, the unknown variables are collectively approximated with a set of surrogate variables. As such, the algorithm is called surrogate variable analysis (sva).
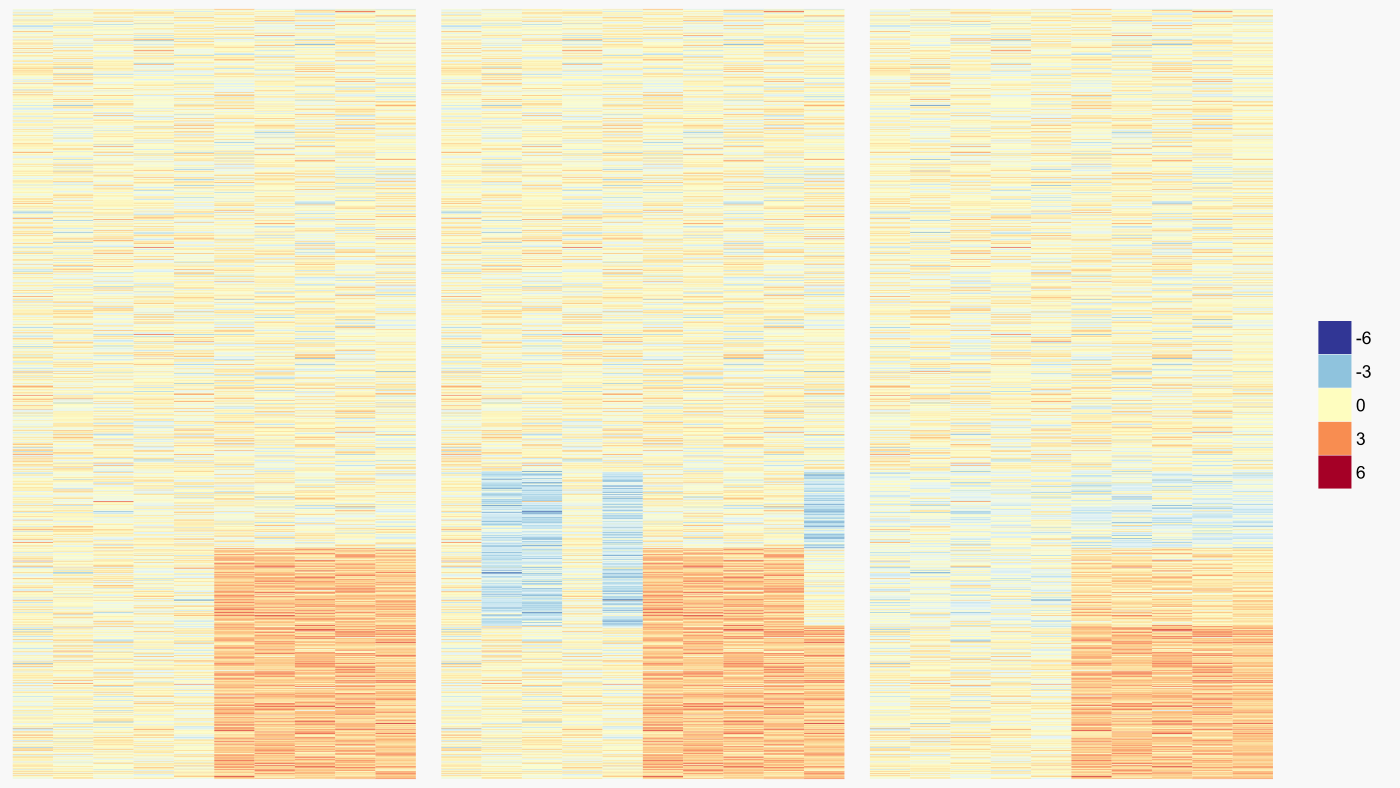
Let’s look at a simulated example of what sva is capable of. For this example, the treatment group has higher expression for 300 genes (figure below - left). There is also an unknown source of variability distributed among both treatment and control groups which reduces the expression of an overlapping set of genes (figure below - middle). Using this expression data, sva discovered one surrogate variable which was then regressed out of the expression data (figure below - right). Through sva, we have essentially eliminated the influence of the obscuring variability. Critically, the influence of the treatment under study remains.
The simplified example above fails to clarify if sva is effective in the messy world of real data. To evaluate sva under more realistic conditions, I compared the similarity between a set of standard gene expression signatures and a separate comparable set of signatures for which surrogate variable analysis was either used or not. If effective, sva should increase the similarity with the evaluation signatures.
The evaluation microarray signatures were generated by the Broad Institute, which treated human cells with 1309 different drugs as part of their Connectivity Mapping project. These signatures can be accessed from the R package ccmap, which also provides functions for ranking these drug signatures based on their similarity to a query signature.
This ranking functionality of ccmap was exploited to evaluate sva. This was accomplished by using query signatures from studies that assayed at least one of 10 drugs also assayed in the ccmap data. These query signatures should have the greatest similarity with the ccmap drug signature for the same drug. If effective, sva should produce signatures with even greater similarity.
In order to quickly generate a large number of query signatures with and without the use of sva, I used the R package crossmeta. For the 10 evaluation drugs, crossmeta was used to generate differential expression signatures for 259 individual contrasts from 125 studies which were then used to generate a single meta-analysis signature for each drug. As such, the effects of both meta-analysis and surrogate variable analysis were tested.
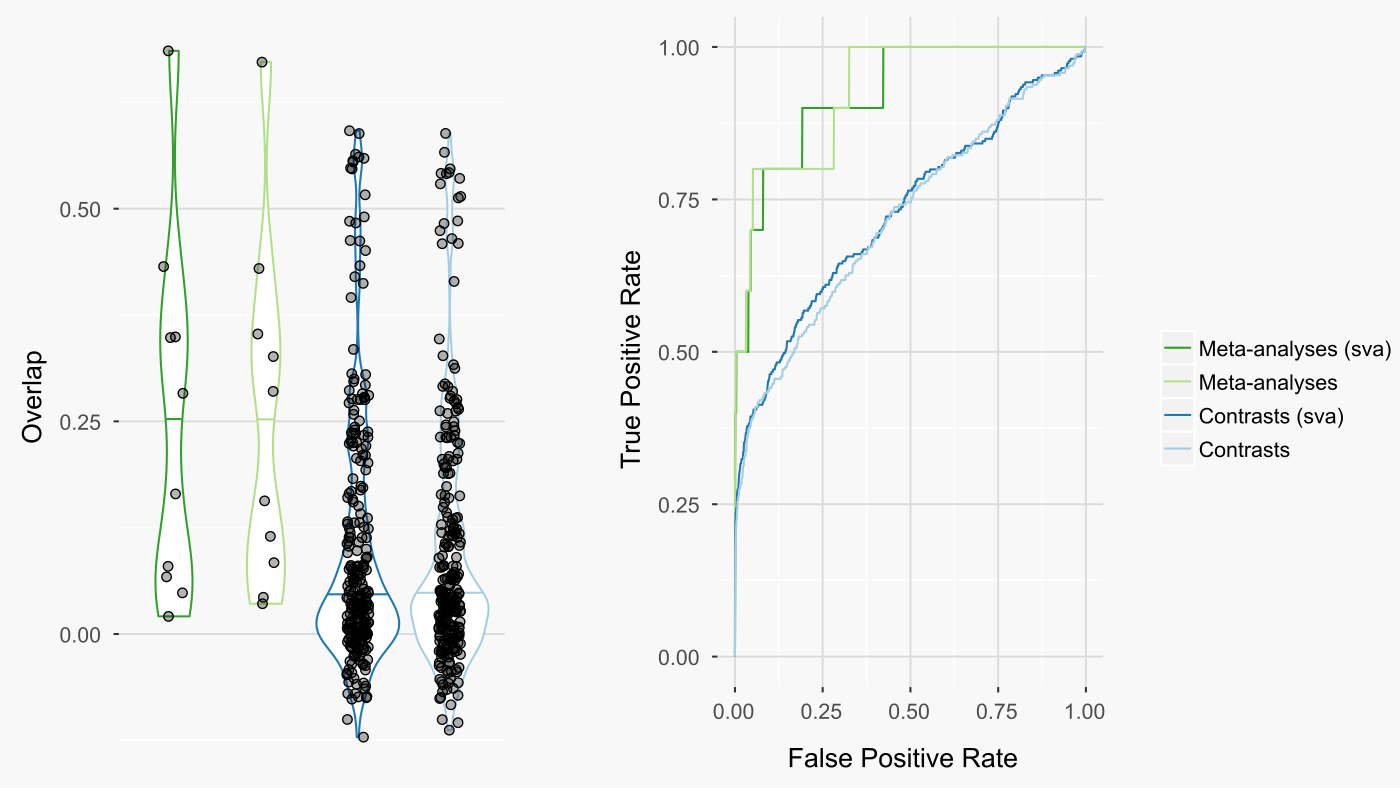
The results were surprisingly unimpressive for sva. Including sva had no substantial impact on either the rankings of the queried drugs amongst all other ccmap drugs (figure below - right) or the overlap between the queried drugs and the same ccmap drugs (figure below - left). In contrast, meta-analysis greatly improved both measures.
Summary
Surrogate variable analysis discovers unknown sources of variation in high dimensional data. Accounting for these sources of variation could potentially prevent faulty conclusions. In this post, I assessed the potential benefits of surrogate variable analysis using a relatively large data set from 125 drug treatment microarray studies. This data set was compared for similarity to a separate reference data set in which the same drugs were assayed. To my surprise, surrogate variable analysis did not appreciably increase the similarity between these comparable data sets. In contrast, the concordance between these two data sets was substantially improved by meta-analysis.